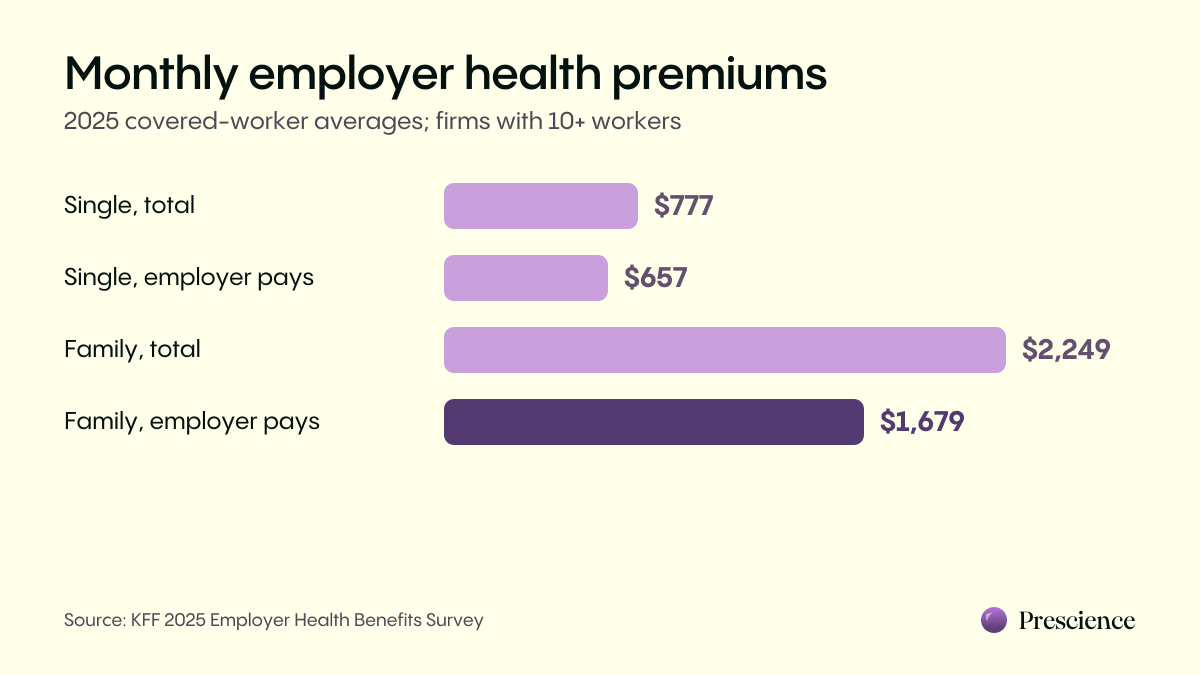
The national averages, per month
| Total premium | Worker pays | Employer pays | |
|---|---|---|---|
| Single coverage | $777 | $120 | $657 |
| Family coverage | $2,249 | $571 | $1,679 |
Annual figures from KFF: $9,325 single and $26,993 family, with workers contributing $1,440 and $6,850 on average. Single premiums rose 5% and family premiums 6% in a year. Over five years, family premiums grew 26%, a little below wage growth (28.6%) and a little above inflation (23.5%).
One change to know about: starting with 2025, KFF's survey covers firms with 10 or more workers. Teams of 3–9 are no longer in the averages, so a very small company should treat these figures as a reference point, not a quote.
Small firms pay about the same premium but shift more to families
Premiums at small firms (10–199 workers) are close to those at large firms. The real difference is who pays. Small employers ask workers with families to pay a much larger share.
| Small firms (10–199) | Large firms (200+) | |
|---|---|---|
| Single premium, per year | $9,211 ($768/month) | $9,361 ($780/month) |
| Family premium, per year | $26,054 ($2,171/month) | $27,280 ($2,273/month) |
| Worker share, single | 16% | 16% |
| Worker share, family | 36% | 23% |
| Worker pays for family, per year | $8,889 ($741/month) | $6,227 ($519/month) |
| Workers who pay more than half the family premium | 29% | 5% |
| Average single deductible | $2,631 | $1,670 |
KFF reports that 53% of covered workers at firms with 10–199 workers have a single deductible of at least $2,000, versus 28% at larger firms. The average deductible row excludes workers without a general deductible. Compare both paycheck deductions and point-of-care costs rather than using premium alone.
What coverage costs in your state
A state average cannot predict a specific employer quote. Rating area, enrollment ages, covered dependents, network and policy benefits all matter. I would use national survey figures for an initial planning range, then replace them with quotes based on the same census and effective date. Do not add an arbitrary city surcharge or assume that every rural plan costs less.
| Input | What to verify | Why it matters |
|---|---|---|
| Employer location | Correct business address and applicable rating area | The insurer applies its geographic rating rules |
| Remote employees | Eligibility and routine network access in every employee location | A headquarters quote does not establish usable coverage elsewhere |
| Ages and dependents | Accurate birth dates and requested covered family members | Age-rated and family-tier methods produce different bills |
| Product | Exact plan, network, formulary and effective date | A state average mixes products and enrolled populations |
| Contribution | Employee-only amount and treatment of incremental dependent cost | Employer spending differs from total premium |
For a multi-state team, ask the insurer how it assigns the group rating area and whether every employee can enroll in the proposed product. State rules also affect permissible age and tobacco variation. See our guides for California, New York and Texas, then verify the specific policy available to your company.
Cost by plan type
| Plan type | Share of covered workers | Single premium | Family premium | Average single deductible |
|---|---|---|---|---|
| PPO | 46% | $9,818 ($818/month) | $28,272 ($2,356/month) | $1,337 |
| HDHP with savings option | 33% | $8,620 ($718/month) | $25,379 ($2,115/month) | $2,609 |
| HMO | 12% | Not in KFF summary | Not in KFF summary | $1,649 |
| POS | 9% | Not in KFF summary | Not in KFF summary | $2,122 |
The PPO and HDHP/SO single-premium averages differ by about $100 monthly, but they represent different enrolled populations and benefit designs. This is not a guaranteed saving for switching the same group. KFF's $690 average employer HSA contribution is for single coverage in HSA-qualified HDHPs and includes workers whose employer contributes nothing. Deductible averages exclude workers without one.
Why your quote is probably different
- Location. Obtain the actual plan rate for the applicable area. Local provider contracts and the available products matter, but a city name alone does not justify a particular premium.
- Ages. Small group rates may rise with age, up to three times for a 64-year-old compared with a 21-year-old. Under the federal default age curve, a 40-year-old costs about 1.28 times a 21-year-old.
- Tobacco. Federal rules allow up to a 1.5:1 ratio where state law permits it; small-group tobacco rating is also subject to wellness-program requirements.
- Plan benefits. Metal levels describe actuarial value, not identical deductibles or networks. Compare actual premiums and service-level cost sharing.
- Dependents. Family coverage costs roughly three times single coverage. Two or three employees with families can move your average a lot.
- Buying route. Include separately quoted broker, administration or PEO service fees. Do not treat hypothetical first-year discounts or renewal increases as market facts.
- Market and funding arrangement. ACA-compliant small-group premiums cannot vary by the group's health status or claims. Large-group and underwritten products use different methods. Confirm which rules apply before interpreting a renewal.
Three illustrative team budgets
The following fictional budgets demonstrate arithmetic only. Dollar rates are selected assumptions, not measured city or state averages, actual quotes or customer information. Each assumes full employee-only payment plus half of the incremental dependent cost. The locations identify scenarios, not expected local prices. Actual ages, benefit design, fees and enrollment can change every result.
To model your own split, see how much employers pay for health insurance, which compares 50%, 75%, 100% and flat-dollar contributions line by line.
Estimate your own cost in 15 minutes
- List who would enroll Collect the census securely, including eligible employees and likely enrollment tiers. Record valid waivers for participation purposes rather than silently removing everyone with another possible coverage source.
- Pick a starting rate Use the published national average only as a labeled provisional input. Ask for rates based on your census and intended start date. Do not assume a fixed adjustment for age or city without the applicable rating method.
- Choose a contribution policy Specify the amount for employee-only coverage and the formula for dependents. Show both employer monthly expense and employee payroll deduction for every tier. Check carrier requirements and applicable affordability rules.
- Add fees and a renewal Add all quoted fees and model several hypothetical future increases. Separate a renewal-rate assumption from hiring and coverage-tier changes so the budget owner can see why spending changes.
- Get two or three real quotes Ask for quotes on the same census from at least two routes (for example a carrier small group plan through a broker, a PEO and a newer option like ours). Compare total annual cost and the deductible and out-of-pocket maximum side by side, not premium alone.
Where the money goes
Federal medical loss ratio rules generally require insurers to meet an 80% standard in individual/small-group markets and 85% in large group, calculated with statutory adjustments and multi-year averaging. Rebates operate at an insurer/state/market level, not as a refund of your company's unused claims budget. The standards do not promise a particular premium or profit margin.
Costs are also still rising quickly. Employers in Mercer's (now Marsh's) 2026 survey expect total health benefit cost per employee to rise 8.2% in 2027 after planned changes, and about 11% if they changed nothing. If your renewal is above that, read why your renewal went up.
Common budgeting mistakes
- Budgeting on single rates only. Your first employee with a spouse and two children can cost three times your average. Budget for the share of your team likely to add dependents in the next year.
- Assuming a renewal. Test multiple hypothetical increases and show the cash reserve required in each case. A market forecast is not the insurer's commitment.
- Ignoring fees. PEO and platform fees are often billed per employee per month on top of premiums.
- Comparing premiums but not cost sharing. A hypothetical $80 monthly employee-premium reduction saves $960 yearly. Compare that with the service costs and maximum exposure under each option; illness alone does not determine which total is lower.
- Assuming every employee enrolls. Some waive because they are on a spouse's plan or Medicare. Price the people who will actually enroll, and check carrier participation rules.
How to pay less without a worse plan
At Prescience, we design and run your company's health plan, from setup and enrollment to claims, compliance and COBRA. What your team gets:
- An effective $0 deductible, so the plan helps from the first visit.
- Simple copays shown before a visit, capped by a low out-of-pocket maximum.
- A broad national PPO network, plus providers we contract with directly.
- 24/7 physician-led care navigation: a care team that finds the right provider, books appointments and explains costs up front.
What your company gets: one monthly cost set in your quote, usually 10–20% below comparable fully insured coverage and fixed before the plan starts, with no admin fees. You keep your payroll provider, and the plan can start mid-year.
Check the model against the first invoice
I would keep a simple reconciliation with one row per enrollee: coverage tier, total premium, employer amount, employee amount and effective date. The employer and employee columns must sum to the premium for every row. Keep fees in a separate column so a fixed service charge is not confused with medical premium. Compare the insurer's enrollment confirmation with payroll before the first deduction.
If an employee adds dependents or leaves during the year, model the actual effective date and ask about prorating or credits under the policy. Do not multiply the final month's bill by twelve and label it actual annual spending. For planning, keep a stable-enrollment scenario alongside a hiring scenario. That distinction makes it easier to explain why total benefit spending increased even when the rate per enrolled person changed little.
See what your team would pay with Prescience
Answer a few questions about your team and get a quote in about 60 seconds, or talk it through with one of our benefits experts.